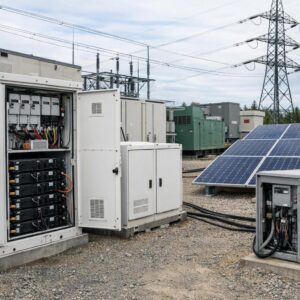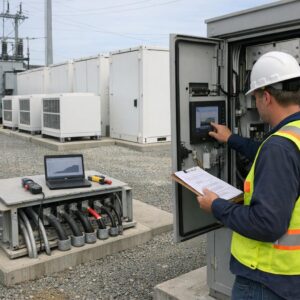
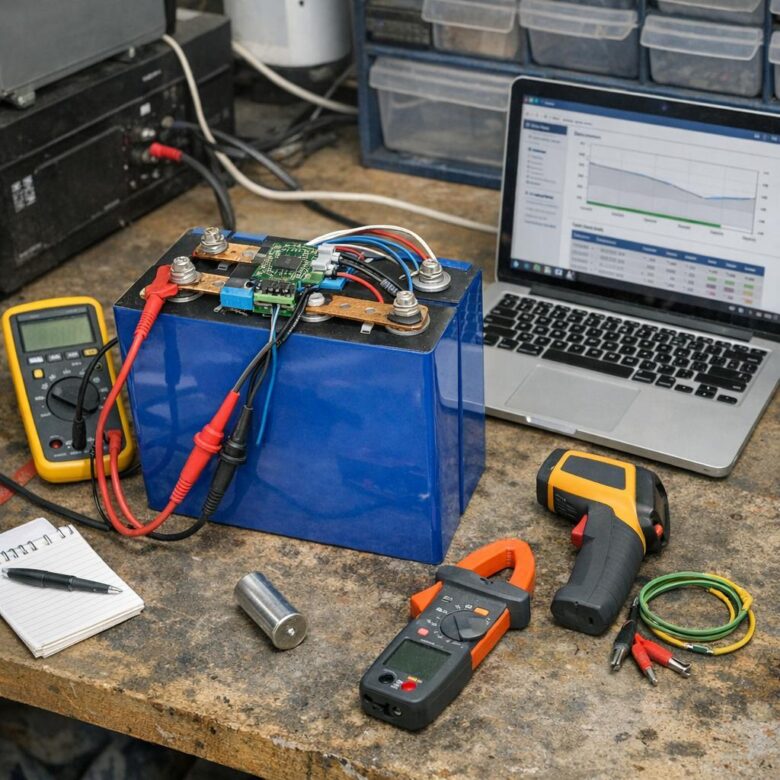
Reliable LiFePO4 health monitoring is built from trends, not isolated readings. Capacity, resistance, cell balance, temperature, alarms, operating history, and system efficiency must be evaluated together to distinguish normal aging from installation faults, control problems, and emerging battery defects.
Battery safety warning: stationary lithium-ion systems can contain hazardous DC voltage, very high fault current, stored energy, energized conductors, pressurized cells, and fire or gas-release risks. Do not open battery modules, bypass the battery management system, defeat interlocks, alter protection limits, connect unapproved test equipment, or work inside energized cabinets unless you are trained, authorized, and following the manufacturer’s procedures and the site’s electrical-safety plan.
Lithium iron phosphate, commonly abbreviated as LFP or LiFePO4, is widely used in commercial solar-plus-storage systems, microgrids, backup-power installations, industrial facilities, and stationary energy-storage projects.
LFP chemistry is valued for long cycle potential and comparatively stable thermal behavior, but it is not maintenance-free or risk-free. Cells still lose usable capacity, develop higher resistance, drift apart electrically, respond to temperature, and depend on correctly operating sensors, contactors, communications, cooling systems, chargers, power conversion equipment, and battery-management controls.
The most important monitoring question is not simply, “What voltage does the battery show today?” A more useful question is, “How has the complete battery system changed compared with its verified commissioning baseline under similar operating conditions?”
Core principle: state of charge shows how full the battery is now. State of health describes how much useful capability remains compared with an agreed reference condition. A battery can report 100% state of charge while still having reduced capacity, increased resistance, poor cell balance, abnormal temperature spread, or repeated protection events.
What Battery Health Actually Includes
No single indicator describes all four areas. Capacity loss may occur without an obvious resting-voltage change. Resistance growth may reduce peak power before energy capacity becomes unacceptable. A communications fault can make a healthy battery unavailable, while a wiring or cooling problem can make a healthy module appear defective.
Monitor the System at Three Levels
Electrochemical Condition
Review individual cell or module voltage, temperature, balance behavior, resistance indicators, capacity contribution, and repeated limit events.
BMS and Protection
Review state estimates, contactor operation, insulation monitoring, alarms, current sensors, temperature sensors, interlocks, firmware, and communication quality.
Energy-Storage System
Review inverter efficiency, auxiliary consumption, HVAC operation, dispatch, curtailment, availability, metering, alarms, and grid interaction.
A battery fault is not always a cell fault. Low delivered energy can result from inverter cutoffs, restricted dispatch, auxiliary loads, temperature derating, communication loss, incorrect state-of-charge calibration, unavailable racks, or conservative control settings.
Build a Commissioning Baseline First
Health monitoring becomes far more useful when the owner has a trusted baseline from commissioning or an early verified operating period. Without a baseline, later readings are often compared with nominal brochure values that may not represent the installed system, measurement boundary, temperature, discharge rate, or configured state-of-charge window.
Baseline Information to Preserve
- Battery model, serial numbers, firmware, and rack configuration
- Rated and commissioned usable energy
- Approved state-of-charge operating window
- Charge and discharge power limits
- Initial capacity or energy test results
- Initial resistance or pulse-test results where available
- Normal cell-voltage and temperature spreads
- Metering points and measurement accuracy
- Cooling-system settings and auxiliary consumption
- Protection, alarm, and shutdown configuration
The bars above are illustrative rather than universal health thresholds. Each project should use manufacturer, warranty, contract, commissioning, and operating requirements that apply to the exact installed equipment.
The measured and reference values must use comparable temperature, state-of-charge limits, discharge power, cutoff settings, metering boundary, and auxiliary-load treatment. Capacity-based SoH does not capture every safety or power-capability issue.
Do not use the nameplate rating as the only reference. The commissioned system may intentionally reserve energy at the top or bottom of the state-of-charge range, and usable AC energy will differ from cell-level DC capacity.
Key Indicators to Trend
| Indicator | What It Can Reveal | Important Limitation |
|---|---|---|
| Usable energy capacity | Capacity fade | Must be tested under comparable conditions and measurement boundaries |
| State of charge | Current energy estimate | Can drift when calibration, current measurement, or BMS estimation is inaccurate |
| Cell-voltage spread | Imbalance trend | Interpretation depends on charge level, current, temperature, and balancing strategy |
| Temperature spread | Cooling or cell issue | Sensor location and calibration can influence apparent differences |
| Voltage response under load | Resistance and connection clues | Includes cable, busbar, contactor, fuse, and inverter effects |
| Round-trip efficiency | System performance change | Includes inverter, transformer, HVAC, controls, and auxiliary consumption |
| Alarm and trip history | Recurring abnormal conditions | Requires accurate timestamps and event context |
| Equivalent cycles and throughput | Usage intensity | Cycle count alone does not represent temperature, depth, rate, or calendar aging |
Step-by-Step Monitoring Workflow
-
Identify the exact system configuration.
Record cell chemistry, module and rack models, system voltage, usable-energy rating, BMS version, inverter model, cooling method, operating limits, and current warranty requirements. -
Confirm the data path.
Determine which measurements come from cell sensors, rack controllers, the master BMS, inverter, energy-management system, revenue meter, auxiliary meter, and external power-quality equipment. -
Review active alarms before reviewing averages.
Examine over-voltage, under-voltage, over-current, temperature, isolation, contactor, sensor, communication, cooling, and state-estimation events. -
Check state-of-charge behavior.
Compare reported state of charge with metered energy, dispatch duration, charge acceptance, discharge duration, and expected operational limits. -
Trend cell and module consistency.
Compare voltage and temperature differences at similar current, temperature, and state-of-charge conditions rather than reacting to one isolated value. -
Review voltage response under charge and discharge.
Look for increasing voltage sag, early limit events, rapid voltage rise during charging, or one rack reaching a protection limit before the others. -
Evaluate temperature and cooling performance.
Compare ambient, inlet, outlet, cabinet, module, and cell-sensor data. Investigate persistent hot zones, rapid changes, or uneven cooling. -
Compare energy in and energy out.
Use consistent meter boundaries to evaluate charge energy, discharge energy, auxiliary use, inverter losses, and overall round-trip efficiency. -
Perform controlled capacity testing when justified.
Follow the manufacturer or service provider’s approved procedure and avoid unnecessary deep testing that adds wear or disrupts operations. -
Document findings and corrective actions.
Record the date, operating condition, alarm code, affected rack, measurements, investigation, firmware changes, replaced components, and verification results.
Why Voltage Alone Is Misleading
LFP cells have a relatively flat open-circuit-voltage profile through a substantial portion of their operating range. That characteristic makes voltage useful for identifying obvious extremes and abnormal behavior, but less reliable as a precise stand-alone state-of-charge indicator through the middle of the range.
Voltage also changes with current, temperature, recent charge or discharge activity, measurement location, and internal resistance. A rack voltage recorded during a high-power discharge cannot be compared directly with a rested open-circuit reading.
| Voltage Observation | Possible Explanation | Better Next Check |
|---|---|---|
| Pack voltage looks normal at rest | Battery may be charged, but capacity and power capability remain unverified | Review energy throughput, load response, cell spread, and capacity trend |
| Voltage drops sharply under load | Low charge, resistance growth, poor connection, contactor loss, cable drop, or excessive current | Compare cell, module, bus, and terminal voltage during the same event |
| One cell reaches the upper limit early | Imbalance, reduced capacity, sensor issue, or charging-control problem | Review repeated top-of-charge behavior and balancing activity |
| One cell reaches the lower limit early | Weak cell group, imbalance, reduced usable capacity, or measurement error | Review discharge history, capacity contribution, and service guidance |
| Devices show different voltages | Calibration difference, wiring drop, communication delay, or different measurement points | Verify timestamps, sensor locations, calibration, and approved test procedure |
Use synchronized data. Cell voltage, rack current, temperature, inverter power, and state of charge should be compared using matching timestamps. A few seconds of delay can misrepresent a fast charge, discharge, or trip event.
Monitor Cell Balance as a Trend
A battery rack is limited by the first cell or cell group that reaches an upper or lower protection limit. One drifting cell can therefore reduce the usable energy of the complete rack even when total pack voltage appears acceptable.
Cell-voltage differences should be compared at similar operating points. A spread measured near the top of charge may be more revealing than a spread measured in the flat middle region, but the correct interpretation depends on the manufacturer’s balancing method and BMS strategy.
- Trend the same rack and cell positions over time
- Compare readings at similar state of charge
- Record charge or discharge current during the reading
- Record temperature during the comparison
- Check whether balancing was active
- Investigate cells that repeatedly reach limits first
- Confirm sensor accuracy before condemning a cell
- Follow the manufacturer’s balancing procedure
There is no universal cell-delta threshold for every LFP system. Acceptable differences depend on cell design, pack configuration, operating point, current, temperature, BMS logic, sensor accuracy, and manufacturer requirements.
Track Temperature and Cooling Performance
Temperature affects available power, charge acceptance, efficiency, calendar aging, cycle aging, and safety. High temperature can accelerate degradation, while charging below the approved low-temperature limit can damage lithium-ion cells.
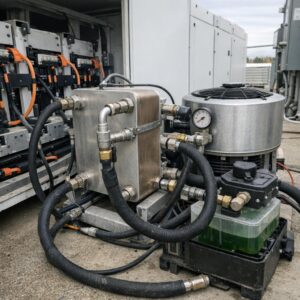
Commercial systems should monitor more than the highest temperature. The spread between racks, modules, and sensor locations can reveal blocked airflow, failed fans, coolant problems, poor cabinet sealing, uneven loading, inaccurate sensors, or a local electrical-resistance issue.
| Temperature Pattern | Possible Cause | Response |
|---|---|---|
| All racks gradually run hotter | Higher ambient temperature, HVAC degradation, blocked filters, or heavier duty cycle | Review cooling capacity, airflow, maintenance, loading, and weather data |
| One rack remains hotter | Airflow imbalance, sensor issue, connection resistance, internal defect, or unequal dispatch | Compare current, voltage, sensor validation, and thermal inspection procedures |
| Temperature rises rapidly under moderate load | Increased resistance, cooling fault, loose connection, or abnormal cell behavior | Reduce stress if required and investigate before normal operation resumes |
| Low-temperature charge alarm | Battery temperature below the approved charging range | Do not bypass protection; restore approved conditions and inspect controls |
| Sensor reading is fixed or unrealistic | Sensor, wiring, scaling, firmware, or communication fault | Validate the sensor and preserve safe operating limits until corrected |
Stop treating abnormal heat as a monitoring problem only. Rapid heating, smoke, venting, unusual odor, swelling, damaged enclosures, water intrusion, or repeated critical alarms require the site’s emergency response procedure and qualified professional assessment.
Use Capacity Tests Carefully
A controlled energy-capacity test is one of the clearest ways to evaluate capacity-based state of health, but the test must be repeatable. Different discharge rates, temperatures, reserve limits, inverter cutoffs, auxiliary loads, and meter locations can create apparently different capacities even when cell condition has not changed.
A Defensible Test Should Define
- Starting state of charge and stabilization conditions
- Approved charge-completion criteria
- Discharge power or current profile
- Ambient and battery temperature
- Ending state of charge or cutoff limit
- DC or AC energy measurement boundary
- Auxiliary loads included or excluded
- Unavailable racks or derating conditions
- Meter accuracy and data interval
- Rest periods and recovery behavior
Capacity tests should be scheduled according to manufacturer guidance, warranty requirements, project criticality, observed trends, and maintenance strategy. Frequent full-range tests can add unnecessary cycling and may disrupt commercial operation.
Compare equal tests. A new-system DC capacity test should not be compared directly with a later AC test that includes inverter losses, HVAC use, transformer losses, and a different state-of-charge window.
Resistance and Power Capability Matter Too
Battery aging is commonly associated with both capacity loss and resistance growth. A system may retain enough energy for a low-power application while becoming unable to support its original peak charge or discharge power without excessive voltage movement or heating.
Resistance-related indicators may be estimated through controlled current pulses, voltage response, BMS diagnostics, electrochemical methods, or manufacturer-specific tests. The method and equipment should be appropriate for the installed battery and should not bypass protection.
A sudden increase in apparent resistance does not automatically prove cell degradation. Loose connections, corroded terminals, contactor wear, fuse resistance, damaged busbars, cable problems, cold temperature, or measurement timing can create similar symptoms.
Investigate step changes differently from gradual aging. Slow resistance growth may reflect normal degradation. A sudden jump after maintenance, a fault, water exposure, or a connection change may point to an installation or equipment problem.
Review BMS Alarms as a History, Not a Snapshot
The battery management system is responsible for monitoring and protective functions defined by the system design. Depending on the product, it may supervise cell voltage, temperature, current, state estimates, contactors, isolation, communication, cooling requests, and charge or discharge limits.
| Alarm or Event | Possible Causes | Safe Next Action |
|---|---|---|
| Cell over-voltage | Incorrect charge command, imbalance, sensor issue, weak cell group, or communication delay | Stop repeated charging to the limit and review event data and approved settings |
| Cell under-voltage | Deep discharge, imbalance, unexpected load, state-estimation error, or reduced capacity | Remove unnecessary demand if safe and follow the approved recovery process |
| Over-current | Load surge, inverter command, short circuit, protection coordination, or sensor fault | Do not repeatedly reset until the actual current path and event cause are understood |
| Over-temperature | Cooling failure, excessive power, high ambient temperature, resistance, or internal fault | Follow shutdown and emergency procedures appropriate to the severity |
| Isolation fault | Insulation damage, moisture, contamination, wiring fault, or measurement problem | Keep the system in a safe state and use qualified high-voltage diagnostics |
| Contactor fault | Coil, feedback, welded contact, pre-charge, auxiliary supply, or control issue | Do not bypass the contactor or interlock; follow service procedures |
| Communication loss | Network fault, power loss, address conflict, firmware issue, cable, switch, or gateway failure | Verify that safe fallback limits remain active before restoring dispatch |
Repeated alarms are often more informative than one event. Record which rack triggered first, the current and temperature at the time, whether the system was charging or discharging, how long the event lasted, and what action cleared it.
Monitor System Efficiency Without Blaming the Cells
Declining round-trip efficiency can indicate a problem, but it is a system-level metric. The result may include losses in the battery, inverter, transformer, cables, cooling equipment, controls, standby systems, heaters, pumps, and communication hardware.
Efficiency should be compared across similar power levels, temperatures, state-of-charge ranges, dwell times, and measurement boundaries. Low-power operation may appear less efficient because fixed auxiliary loads represent a larger share of the transferred energy.
| Efficiency Change | Possible Explanation | Useful Check |
|---|---|---|
| Efficiency falls mainly in hot weather | Higher HVAC demand, thermal derating, or temperature-related losses | Separate auxiliary energy from battery and inverter losses |
| Efficiency falls at low power | Fixed standby and auxiliary consumption becomes proportionally larger | Compare efficiency by power band rather than one annual average |
| One rack transfers less energy | Derating, imbalance, unavailable module, resistance, or control limit | Compare rack current, cell limits, temperature, and alarms |
| AC energy changes but DC data does not | Inverter, transformer, auxiliary, or metering issue | Review all meter boundaries and timestamp alignment |
Keep a Useful Monitoring Log
Recommended Log Fields
| Date and Time | Operating Condition | Measurements | Event or Observation | Action and Result |
|---|---|---|---|---|
| Record time zone and synchronized timestamp | Charging, discharging, idle, standby, grid outage, maintenance, or test | SoC, power, energy, cell delta, temperature spread, voltage, alarms | Affected rack, alarm code, duration, weather, recent maintenance | Inspection, reset, firmware change, repair, replacement, verification |
A consistent log supports warranty claims, root-cause analysis, preventive maintenance, capacity planning, and replacement decisions. It also reduces the risk of treating a recurring system problem as a series of unrelated events.
Suggested Monitoring Cadence
The appropriate frequency depends on the manufacturer’s maintenance instructions, system criticality, warranty, operating profile, local requirements, and observed condition. A hospital microgrid, remote industrial site, or high-duty market asset may require more active review than a lightly cycled backup system.
Common Monitoring Mistakes
| Mistake | Why It Causes Confusion | Better Practice |
|---|---|---|
| Using voltage as the only health indicator | LFP voltage is relatively flat through much of its operating range | Combine capacity, current, temperature, cell data, alarms, and runtime |
| Comparing data from different operating conditions | Current, temperature, state of charge, and rest time change the readings | Compare similar conditions and preserve context |
| Trusting one state-of-charge percentage blindly | Estimates can drift because of calibration, sensors, current integration, or firmware | Compare state of charge with metered energy and actual operating duration |
| Ignoring unavailable modules or racks | System capacity can decline even when healthy racks remain normal | Track available energy and availability separately |
| Changing BMS limits to stop alarms | The alarm may be protecting the battery from a real abnormal condition | Find the cause and use manufacturer-approved settings |
| Comparing DC and AC energy as if they were identical | Inverter, transformer, cable, and auxiliary losses are omitted | Label every measurement boundary clearly |
| Performing frequent deep capacity tests | Adds cycling, disrupts operation, and may violate procedures | Test only when justified and follow the approved method |
| Ignoring firmware and configuration changes | State estimates, limits, alarms, and control behavior may change | Maintain controlled configuration and change records |
How to Classify the Next Action
Continue Trending
Readings remain within approved limits, alarms are absent, performance is stable, and small variations do not show a worsening pattern.
Schedule Investigation
Capacity, resistance, cell spread, temperature spread, efficiency, state estimation, or alarm frequency shows a repeatable adverse trend.
Stop and Escalate
Critical alarms, abnormal heat, smoke, venting, swelling, unusual odor, water intrusion, damaged enclosures, isolation faults, or unexplained repeated shutdowns occur.
When Replacement Should Be Considered
Replacement should be based on the application’s required performance, safety condition, warranty terms, serviceability, and economic value rather than one generic percentage.
A battery may remain technically operational but no longer provide enough duration for a critical backup requirement. Another system may tolerate lower capacity because its primary role is short-duration peak control. Power capability, availability, cell consistency, safety condition, and compatible replacement supply can be as important as measured energy capacity.
- Usable energy no longer meets the operating requirement
- Power capability is inadequate for normal dispatch
- One rack repeatedly reaches limits before the others
- Resistance or heating shows a worsening trend
- Critical alarms repeat after approved corrective work
- Physical damage or contamination affects safe operation
- Replacement parts or technical support are unavailable
- Warranty or contract thresholds have been reached
- Downtime and maintenance costs have become excessive
- The system cannot meet required safety or compliance conditions
Do not mix replacement modules casually. Differences in model, firmware, age, capacity, resistance, balancing strategy, voltage behavior, and manufacturer approval can create integration and warranty problems.
Final Recommendation
Effective LFP health monitoring starts with a verified baseline and a clear definition of the service the battery must continue delivering. The owner should trend usable capacity, power capability, cell consistency, temperature, alarms, efficiency, availability, and operating history using synchronized measurements.
Voltage should be treated as one clue rather than the complete diagnosis. Capacity tests should use repeatable conditions, cell balance should be evaluated as a trend, and resistance-related changes should be separated from wiring, connection, contactor, temperature, and inverter effects.
For commercial and industrial systems, monitoring should also include the BMS, communications, cooling equipment, power conversion system, auxiliary loads, protection, firmware, and configuration control. When safety alarms, abnormal heat, physical damage, isolation problems, or unexplained shutdowns occur, the appropriate response is qualified investigation—not repeated resetting or bypassing protection.
Frequently Asked Questions
Can LiFePO4 health be checked from voltage alone?
No. Voltage can reveal obvious limits and abnormal behavior, but the relatively flat LFP voltage profile makes it a weak stand-alone indicator across much of the operating range. Combine it with capacity, current, temperature, cell spread, alarms, state estimates, and energy throughput.
What is the difference between state of charge and state of health?
State of charge estimates how full the battery is at a particular moment. State of health compares current capability with a defined reference condition and may include capacity, resistance, power capability, consistency, and reliability.
How often should a commercial battery receive a capacity test?
There is no universal interval. Follow the manufacturer’s instructions, warranty, maintenance plan, applicable standards, operating duty, system criticality, and observed performance trends. Continuous monitoring does not automatically replace scheduled testing.
Does a higher cycle count always mean worse health?
No. Battery aging also depends on calendar time, temperature, state-of-charge history, charge and discharge rate, depth of discharge, dwell time, and operating limits. Cycle count should be interpreted with throughput and operating conditions.
Why does one rack shut down before the others?
One cell group may reach a voltage or temperature limit first, the rack may be imbalanced, a sensor may be inaccurate, resistance may have increased, cooling may differ, or the rack may have a communication or contactor problem. Review synchronized cell, current, temperature, and alarm data.
Can a BMS state-of-charge reading become inaccurate?
Yes. State estimates can drift because of current-sensor error, calibration, configuration, partial cycling, communication problems, firmware, or an incorrect capacity value. Compare the estimate with metered energy and real operating duration.
Is LiFePO4 completely safe from thermal runaway?
No lithium-ion chemistry should be treated as risk-free. LFP generally has stronger thermal stability than some other common lithium-ion cathode chemistries, but electrical abuse, internal defects, external heating, physical damage, installation faults, and propagation risks still require certified equipment, protection, monitoring, and emergency planning.
When should the manufacturer or a qualified specialist be contacted?
Escalate repeated alarms, unexplained capacity loss, abnormal heating, growing imbalance, isolation faults, water exposure, damaged equipment, repeated contactor failures, communication loss affecting protection, or any condition that cannot be safely diagnosed under approved procedures.
Official Standards and Technical References
- IEEE 2962-2025 — Installation, Operation, Maintenance, Testing, and Replacement of Lithium-Ion Batteries for Stationary Applications
- IEEE 2686-2024 — Battery Management Systems in Stationary Energy Storage Applications
- IEEE 1679.1-2025 — Characterization and Evaluation of Lithium-Based Batteries in Stationary Applications
- UL Solutions — Energy Storage System Testing and Certification
- U.S. Department of Energy — Battery Energy Storage System Evaluation Method
- National Renewable Energy Laboratory — Battery Lifespan and Health Diagnostics Research

The Ogumex Editorial Team creates practical, research-based content about commercial solar energy, battery storage, clean technologies, and sustainable industrial solutions. Our goal is to explain complex topics clearly, helping professionals, businesses, and informed readers make better decisions. Each article is reviewed for clarity, accuracy, and usefulness using reliable industry and official sources.